Meeting the Needs of the Community: Chapter 5 Demographics of Totton
- Clive Evans
- Jul 11, 2020
- 5 min read
1. Totton, situated on the west bank of the River Test in Hampshire, is divided into 5 separate political wards, Totton Central (Figure 5.1), Totton East (Figure 5.2), Totton North (Figure 5.3), Totton South (Figure 5.4) and Totton West (Figure 5.5).

Figure 5.1– Totton central (Source Ordnance survey)

Figure 5.2 - Totton East (Source Ordnance survey)

Figure 5.3 - Totton North (Source Ordnance survey)

Figure 5.4 - Totton South (Source Ordnance survey)

Figure 5.5 - Totton West (Source Ordnance survey)
2. The population of the town at the time of the 2011 Census was given as 28,970, and the corresponding bar chart (Figure 5.6) reveals how the population was composed according to age.

Figure 5.6 Full population distribution – Totton 2011 (source: ONS)
3. With this type of distribution, the average age of the population is established using the median, which when all the ages are lined up in order, the mid-point is taken as the average. So, for example if you had a sample of 500 people with their ages put in order, the median would be the age of the 250th person in that group.
4. It is however customary to quote with the median, the mean, which is the recognised average where all the ages are added together and then divided by the total population (table 5.1). In either case the average age of the population has increased over the ten years between 2001 and 2011.

Table 5.1 Average age of Totton 2001 and 2011
5. Using the average age of the population does not fully explain what is happening to the population, or for that matter why. To answer these questions, and to avoid large data sets, it is customary to categorise the population into larger age groups as shown in table 5.2.

Table 5.2 Population distribution - Totton 2001/2011(Source: ONS)
6. Examining the population in this way begins to show that the average age of the town increased due to a reduction in the child population, and an increase in the adults over the age of 45.
7. One possible explanation for the ageing population is the so called ‘Baby Boom’ that occurred after the Second World War. This would certainly account for some of the increase in population size seen in the older generations. However, it is unlikely that it is the only reason, and it has been suggested that the increase is due to the development of West and South Totton in the 1980s, which increased the population of Totton, and more specifically, in what would now be the older generations (Marwick, 2003).
8. Whilst figure 5.6 shows the age distribution for the whole town, it would be wrong to assume that the distribution is evenly spread. Figure 5.7 shows the age distribution for each of the political wards, and what each line on the graph shows is that each area has its own unique demography, and how together they form the demography of the population.
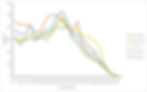
Figure 5.7 Population distribution – Totton wards 2011
9. One possible explanation for some of the peaks in the graph could be related to house prices. Using the website ‘Zoopla’ the average price for a sample of five roads in North Totton was £249,000, compared to 5 roads in West Totton, averaging £317,000 and South Totton, averaging £352,000 (Zoopla Limited, 2020). This suggests that younger families with lower incomes are buying properties on the Calmore Estate, and older families or those with higher incomes buying properties in West and South Totton.
10. Any examination of the demographics of any community, should not just focus on population size or age, but also on other aspects of that community, which can ultimately influence the level of deprivation or poverty found within that community. Table 5.3 shows who in Totton over the age of 16 were employed or if not some of the reasons why.

Table 5.3 economic activity – Totton 2011 (source: ONS)
11. As the data reveals, whilst 68% of the population at that time were in some type of employment, there was a significant proportion of the population who were receiving or may have required assistance from the benefits system.
12. The economic activity data does not though provide a complete picture as to the health of the town. Table 5.4 provides details of the level of long-term health problems or disability recorded at the 2011 Census.

Table 5.4 long term health or disability (source: ONS)
13. What becomes clear from table 5.4 is that the older the population gets, the more health issues are encountered, but more importantly that in 2011 16% of the population was having to deal with a condition that was restricting their daily activity in some form.
14. With a significant proportion of the population claiming that they were having difficulty being able to carry out day to day activities, it is reasonable to assume that some if not all had issues with mobility, meaning that access to a car would be important. Table 5.5 details the number of vehicles available to all households within Totton. What is of importance here is the number of households that do not have access to a vehicle, meaning that there must be a heavy reliance on others or public transport.

Table 5.5 Vehicles available to households, Totton, 2011 (source: ONS)
15. Another important aspect of examining the demographics of any location is to determine the composition of each household within each given location (table 5.6). From the information provided within this table it becomes clear that integral to the stability of Totton is the family unit.

Table 5.6 Household Composition, Totton 2011 (source: ONS)
16. The 2011 Census also revealed the level of social housing within the town. Analysis of household tenure revealed that out of the 12,128 recorded households, 1,448 (11.9% of total housing stock) was social housing (table 5.7).

Table 5.7 Housing Tenure within Totton
17. The data can be further interrogated to reveal that within the social housing stock 562 properties, 39% (table 5.8), contained families with dependent children (under the age of 18).

Table 5.8 Household Composition in social housing Totton
18. A review of the current level of social housing within Totton reveals that the level of social housing within the town has reduced to 1,193 (UK Social Housing, 2020). Although there has been an increase since the 2011 Census in social housing, such as Stockland Mews in Calmore, if it is assumed that there has been only a small increase, this equates to 9.8% of the total housing stock.
19. Whilst table 5.6 provides details of the number of households which have families within them, it does not fully reveal that marriage in 2011, ignoring divorce and remarriage, was alive and well in Totton (Table 5.9).

Table 5.9 Marital status within Totton in 2011 (source: ONS)
20. Whilst the age of Totton may be increasing, Census data also showed that the ethnic diversity of the population was also diversifying (table 5.10).

Table 5.10 Ethnic groupings Totton 2011 (Source: ONS)
21. However, the ethnic diversity of the population of Totton does not though indicate nationality and citizenship. Table 5.11 details which types of passport were held and reveals that most of the population of Totton held a UK passport.

Table 5.11 Passports Held in Totton 2011 (Source: ONS)
22. This ethnic diversity has an interesting influence on the declared beliefs of the population of Totton (Table 5.12), with 63% of the population still claiming to be Christian, which is likely to be more historic in nature than actual.

Table 5.12 Declared Religious beliefs in Totton 2011 (source: ONS)
23. In summary, based upon the 2011 Census data, Totton is a family orientated community that encountered rapid growth in the 1980s, resulting in a larger elderly population who are encountering health and long-term mobility issues related to age. Whilst most of the population remain white, the ethnicity of the population is changing together with its religious beliefs, but firmly remains British. However, as will be discussed in the next chapter, the demographics of the town do not reveal the underlying problems faced by residents of the town.